
Team insights provide you with insights on the hand hygiene of your team.
The data is presented in a bar chart displaying one bar for each employee wearing a Sani ID at the hospital. Colours are used to intuitively show the high performers and the low performers. Filtering options are available to dive into the data. You can filter on staff groups, wards, dates and room types. You can learn more about hand hygiene levels here.

Bar chart
Each bar in the chart represents a staff member wearing a Sani ID that has been registered by a Sani Sensor. By default, we can see the hand hygiene level for the past month. The colours indicate the performance, with green showing the most compliant staff and red showing the poorest performers.

Hovering over the different colours you can read how many staff members each colour group consists of.

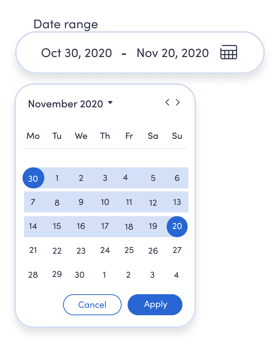
Date range
The date range filter allows you to zoom in on a specific time period. In the interest of employee confidentiality, we allow you to view a minimum of a single week of data at a time.
“Not enough data”
Your search result might say “Not enough data”. To protect anonymity, we can't reveal the hand hygiene level for less than five staff members
“No data”
If your search result says “No data” then no data was collected in the selected time period. Please check that staff are wearing Sani IDs.
Ward
Should you have access to multiple wards, you can filter the data by ward. You can clear the filter at any time. Is there a ward that is doing particularly well? Perhaps you can reward them for good performance.

Staff type
Use the Staff type filter to analyse the hand hygiene of different staff groups. Is there a group that is performing particularly well? What about a group that is struggling to perform good hand hygiene? Perhaps you should arrange a meeting with this group to discuss.

Room type
Look at how each person is performing in the different room types. Perhaps you have a focus on a specific room type in your department. Are there many people that are struggling to perform good hand hygiene? Perhaps the hand hygiene in this room type is what is driving down the hand hygiene level.

How can I use this data?
First, take a look at the general overview. Is the performance as you expected?
Second, start to narrow down in different areas. Is there a staff group or room type that should be focused on?
Third, print out the page to bring to your weekly meetings. Encourage participation and discussion on hand hygiene rules.
Further help
Use Essentials to get an overview of the compliance at the hospital and identify the wards that need the most help.
Take a look at Weekly Improvements to identify the room types at the wards with the lowest and highest compliance.
Encourage your healthcare workers to sign up for Individual Motivation so they can improve their own hand hygiene scores.
Take advantage of the nudging feature in Intelligent Nudging to remind and reinforce good hand hygiene behaviour.